劍橋雅思12寫作Test7Task1范文+題目+解析
2017/8/7 13:32:05來(lái)源:新航道作者:新航道
摘要:很多雅思考生一直想要?jiǎng)蜓潘?2寫作資料,但是卻總是找不到,現(xiàn)在烤鴨不用擔(dān)心了,上海新航道雅思 小編為大家馬上帶來(lái)關(guān)于劍橋雅思12寫作范文Test7Task1的內(nèi)容,供大家參考。
很多雅思考生一直想要?jiǎng)蜓潘?2寫作資料,但是卻總是找不到,現(xiàn)在烤鴨不用擔(dān)心了,上海新航道雅思 小編為大家馬上帶來(lái)關(guān)于劍橋雅思12寫作范文Test7Task1的內(nèi)容,供大家參考。
雅思寫作題目:
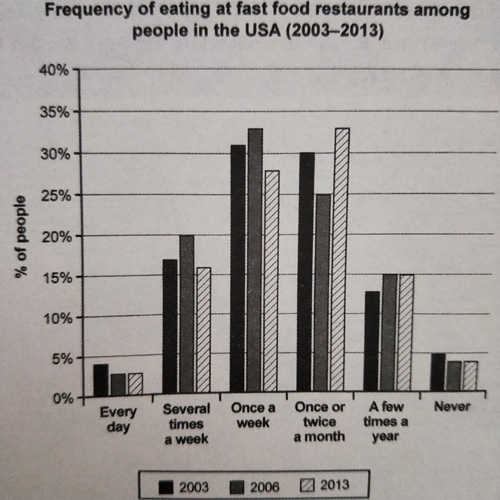
The chart below shows how frequently people in the USA ate in fast food restaurants between 2003 and 2013.
Summarise the information by selecting and reporting the main features, and make comparisons where relevant.
題目分析:
包括回答中需要討論的主要特征、需要進(jìn)行的對(duì)比以及考生可能對(duì)題目產(chǎn)生的錯(cuò)誤理解。
要點(diǎn)
1、考生要寫出三個(gè)年份所對(duì)應(yīng)的吃快餐者比例的升降趨勢(shì)
2、考生要對(duì)這些比例進(jìn)行橫向比較
錯(cuò)誤理解
1、考生可能無(wú)法找到很好的邏輯來(lái)進(jìn)行不同對(duì)象之間的比較;
2、考生誤把題目中的“數(shù)字”當(dāng)作數(shù)量來(lái)進(jìn)行寫作,而不是比例;
3、考生可能會(huì)無(wú)法在合理的字?jǐn)?shù)內(nèi)把圖表的主要信息概括完整。
雅思寫作范文一
The chart shows how often the US citizens ate at fast-food restaurants in the years 2003, 2006 and 2013.
In 2003, the percentages of people who have never eaten fast food and of people who ate every day were about 5% and 4%, respectively. The figures for both groups declined by almost 1% in 2006 and remained unchanged at this level until 2013.
Most people tended to eat fast food once per week or once or twice per month. The percentage of the former group increased slightly to 33% in 2006 before dropping to 28% in 2013. However, the latter group saw an opposite trend. The figure declined to 25% in 2006 but increased sharply to 33% in 2013.
Turning to the rest of two groups, there was 17% of people eating fast food several times a week in 2003 but it rose to 20% in 2006. A similar increase could also be found in those choosing fast food a few times a year, with the number rising to 15% in 2006 from 13% in 2003. Over the next seven years, the former group fell back to 16% while the latter saw no change.
To summarise, it can clearly be seen that most people over this period only eat fast food between 1 and 4 times a month.
雅思寫作譯文一
此圖顯示了美國(guó)民眾在2003年、2006年及2013年前往快餐店消費(fèi)的頻率。
在 2003年,從來(lái)不吃快餐的人數(shù)比例以及每天吃快餐的人數(shù)比例分別占5%和4%。兩組的人數(shù)比例在2006年均下滑約1%,并且到2013年其數(shù)據(jù)一直保持不變。
大多數(shù)人往往一個(gè)星期吃一次或一個(gè)月吃一到兩次快餐。前者人數(shù)比例緩慢增長(zhǎng)到 2006年的33%,之后下降到 2013年的28%。然而,后者則見證了相反的趨勢(shì)。該百分比下降到了 2006年的25%,但到了 2013年增加到了 33%。
對(duì)于剩下的兩組人群來(lái)說(shuō),在 2003年,一周吃數(shù)次快餐的人數(shù)比例約為 17%,但之后增長(zhǎng)到2006年的20%對(duì)于一年吃幾次快餐的比例也同樣有所增加,這個(gè)比例增長(zhǎng)至 2006年的15%,而2003年為13%。在未來(lái)的七年里,前者比例下降到 16%,而后者比例幾乎保持不變。
總之,明顯可以看出大多數(shù)人在此期間每月僅吃一到四次快餐。
雅思寫作范文二
The chart shows the frequency of eating at fast-food restaurants among the US people in the years 2003, 2006 and 2013.
From 2003 to 2006, a slight decline could be found in the percentages of people who had never eaten at a fast food restaurant (5% to 4%) and that of those eating fast food everyday (4% to 3%). The next seven years saw almost no changes in both groups.
The major changes could be seen in the groups who ate in fast-food restaurants once, several times per week or once or twice a month. Compared with other groups, most US citizens ate fast food once a week or 1-2 times a month. These figures ranged from a little over 30%, in 2003, rising slightly in 2006 and then dipping to around 28% in 2013 for the once a week and then 30% to 25% and then up to 33% for those people eating it around once a fortnight.
As for those ate fast-food a few times a week or a few times a year, their percentages were relatively lower. The number of the former group increased by 3% to 20% in 2006 before falling to 16% in 2013, while that of the latter group remained almost unchanged at 15% during the same period.
雅思寫作譯文二
此圖顯示了美國(guó)民眾在2003年、2006年及2013年在快餐店吃快餐的頻率。
在 2003年 至 2006年間,從來(lái)不吃快餐的人數(shù)比例以及那些每天吃快餐的人數(shù)比例分別從5%下降到4%以及4%下降到3%。在接下來(lái)的七年中,該兩組人群比例保持不交。
每周吃快餐一次、數(shù)次的人數(shù)比例以及一個(gè)月吃一到兩次的人數(shù)比例經(jīng)歷了巨大的變化。相比于其他人群,一周吃一次快餐以及一個(gè)月吃一到兩次快餐的人數(shù)最多。一周吃一次快餐的人數(shù)比例在2003年略高于30%,2006年略有上升,然后在2013年下降到 28%左右,然后那些一周吃兩次左右的人數(shù)比例從30%降到25%然后又上升到33%。
對(duì)于那些一周吃幾次快餐以及一年吃幾次的人來(lái)說(shuō),這兩組比例相對(duì)較低。前者上升了3%達(dá)到2006年的20%,之后下降到2013年的16%,而后者在同期內(nèi)幾乎維持在15%的水平。
以上就是劍12雅思寫作范文,更多雅思資料,請(qǐng)點(diǎn)擊:雅思資料頻道
免費(fèi)獲取資料
熱報(bào)課程
- 雅思課程
| 班級(jí)名稱 | 班號(hào) | 開課時(shí)間 | 人數(shù) | 學(xué)費(fèi) | 報(bào)名 |
|---|
免責(zé)聲明
1、如轉(zhuǎn)載本網(wǎng)原創(chuàng)文章,情表明出處
2、本網(wǎng)轉(zhuǎn)載媒體稿件旨在傳播更多有益信息,并不代表同意該觀點(diǎn),本網(wǎng)不承擔(dān)稿件侵權(quán)行為的連帶責(zé)任;
3、如本網(wǎng)轉(zhuǎn)載稿、資料分享涉及版權(quán)等問(wèn)題,請(qǐng)作者見稿后速與新航道聯(lián)系(電話:021-64380066),我們會(huì)第一時(shí)間刪除。
全真模擬測(cè)試

雅思動(dòng)態(tài)

DeepSeekx雅思官方:中國(guó)考生...

制作:每每
